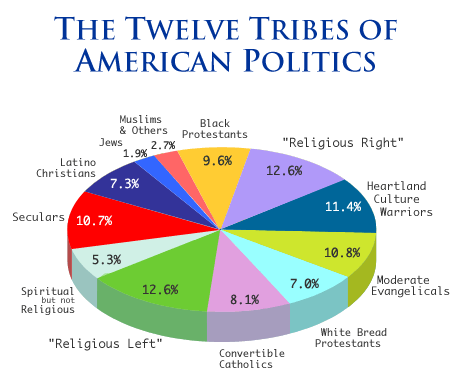
You can read a more complete description of each group and how they voted in the 2004 election here, and an analysis of the voting trends here. I've also written more about it at the Friendly Atheist blog.
The most surprising finding, given common stereotypes of religious people and their politics, was that the Religious Left (their title, not ours) is almost exactly the same size as the Religious Right, both at about 12.6% of the total voting-age population. It’s always good to bust some stereotypes, IMO, and especially to get past this misconception that to be a Christian means one automatically supports the agenda of the Religious Right. According to this data, it’s pretty much just as likely that one doesn’t.
Labels: politics


So now we have 12 pigeonholes instead of 2? ;-)
I don't know. The analysis puts me in "secular" but based on these options I myself would be hard pressed to choose between one of "secular" and "spiritual but not religious" and "religious left".
I also think the "Muslim/Other" category is a gross oversimplification and really shouldn't be presented as a single voting demographic, considering its individual constituents can hardly be called like-minded.
Other than those issues, it does do a pretty decent job of explaining why certain groups of people vote certain ways.